


How is my Confluence site performing? Which metrics should I track? And how? We have all asked these questions at some point. At the end of the day, It wouldn’t make sense to use Confluence if you are not going to dive deeper into the analytics, right?
Well if you are asking yourself these questions, then you are on the right track and at the right article. We will basically cover three basic questions: Why, how and what?
- Why are Confluence Metrics important?
- How to ensure you are tracking the right metrics?
- What metrics can you track with Confluence analytics? And are there any other alternatives?
Why are Confluence metrics important?
To put it simply, it wouldn’t be possible for you to know whether Confluence is serving its purpose if you don’t continuously track KEY metrics and see how they align with your goals.
As your central hub for communication, collaboration and knowledge sharing, Confluence should facilitate your teams’ daily operations and mirror your processes. And in order for you to measure your ROI, engagement and make better informed decisions, you have to leverage Confluence analytics.
How to ensure you are tracking the right metrics?
As the running meme on Linkedin goes, the answer to this kind of question always starts with the usual “It depends”. In reality this is true, what you should be tracking depends on your goals and objectives but the approach remains more or less the same.
So, where should I start? Long before you implement Confluence.
- Understand user needs
By the people, for the people, this is how I would like to think about Confluence. Since your teams will be using Confluence on a daily basis, you should start by identifying their needs, pain points, and areas they would like to improve. For that you can perform an internal audit to understand the tools in use (if there are any). Then, of course, you will lean on both quantitative and qualitative data to identify which areas Confluence can improve and what your teams would like to use it for.
- Determine your goals and objectives
Every journey needs a destination. Similarly, your Confluence implementation should have clear goals and objectives. Are you aiming to improve internal communication, streamline project management, or accelerate knowledge sharing? By defining your objectives upfront, you ensure that your metric tracking efforts are purpose-driven and aligned with your organization’s broader strategy.
- Align goals and metrics
Just as each mile marker brings you closer to your destination, each metric should bring you closer to your goals. Once you’ve identified your objectives, it’s time to select the metrics that best reflect your progress and mirror your needs. If your goal is to boost communication, track metrics such as likes, comments, and page views. For improving knowledge sharing, monitor metrics related to attachments, knowledge contributors, searches, and more. By aligning your goals with specific metrics, you can measure success with clarity and precision.
What metrics can you track with Confluence analytics?
Confluence analytics allows you to track a variety of metrics and give you an overall idea of your site performance, user engagement and activity. You can access Confluence analytics at three main levels: Site, space and page. Each level gives you a complete overview and comes with a slightly different set of metrics.
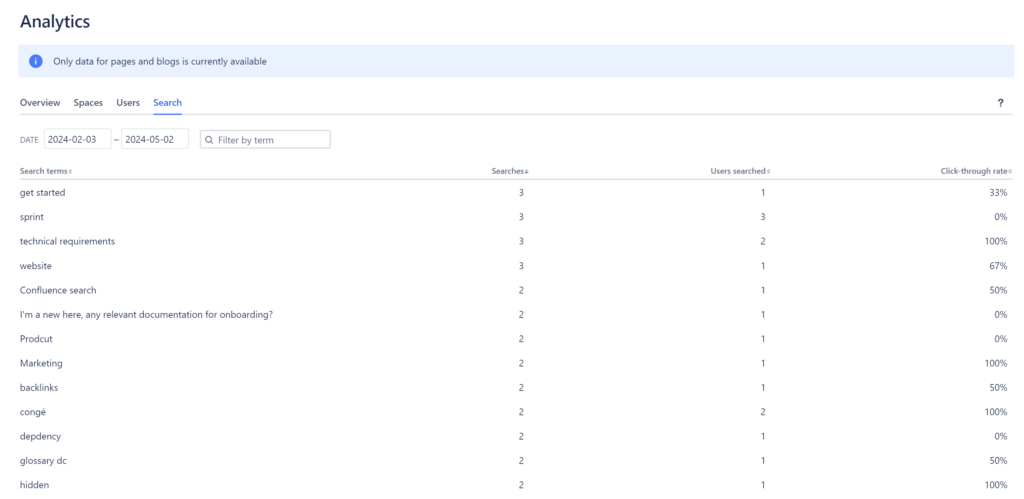
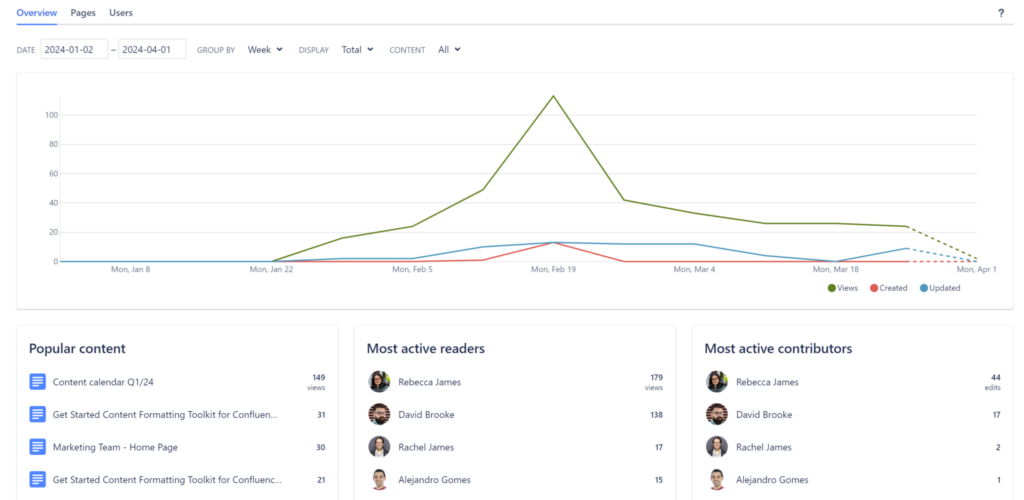
Confluence site analytics
Here you can basically have an overview of your Confluence site’s most popular spaces, searches and users. This is what the managers and the C-suite will basically access to grasp the bigger picture. Of course, spaces, searches and users all have their dedicated tab where you can further fine tune your metrics. For example, within the users tab, you can rank users based on the number of created or updated pages, number of comments, views, and more. As for search, you can check the number of searches for a specific period, how many people searched for specific terms, and more.
Space analytics
This is more or less the same as the Confluence site analytics. The only difference is that you will have a new view containing a list of pages which you can rank based on various criteria including the number of views, date, updates, and more. This is particularly useful in the case of an internal communication hub or an external documentation hub as space managers can have a glimpse of the most popular content for any given period of time.
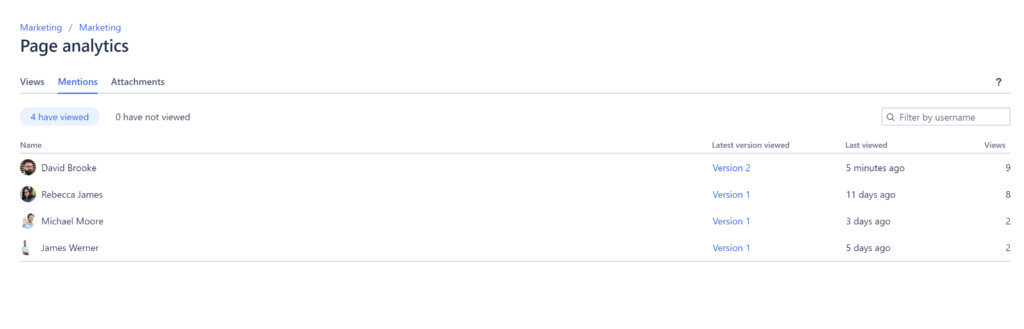
Page analytics
This is by far my favorite analytics feature and the one that I use on a daily basis. The reason: extremely targeted metrics. Basically the page analytics view consists of three main tabs that more or less cover everything you need to track: Views, mentions and attachments. Views are straightforward. You will have a list of users ranked by views and the last version they have seen. The other two tabs though give you convenience and easy access to key information. In the example of a documentation page or meeting notes, you have lots of mentions, action items and attachments. Through the click of a button, you can have a list of all attachments and users who are mentioned within the page. This allows you to easily check whether the content is up to date, identify key mentioned users and export any attachment you might find useful.
Are there any other ways to track metrics in Confluence?
The answer is yes. And as stated earlier it always depends on what you want to track. For example, if you want to build on the existing capabilities of Confluence analytics, there are third party apps designed to help you achieve just that. For example, Viewtracker – Analytics for Confluence by Bitvoodoo, allows you to get more insights about your users activity, engagement, and most importantly, third party apps and platforms. The app’s deep integration with the likes of Jira Service Management, Scroll Viewport or Refined allows you to get detailed analytics you would not have had with the basic Confluence Analytics.
In case you are used to Google Analytics metrics, well, of course, there is an app for that. Google Analytics for Confluence: Page view tracker & reports by resolution Reichert Network Solutions GmbH, allows you to connect your Confluence site with Google analytics. Then, you can unlock a host of advanced analytics including pages, events, acquisition, traffic source, demographics, and more. The kind of metrics suitable for marketers, internal communications specialists, and other roles revolving around content creation and community building.
Well we covered Confluence built-in analytics capabilities and third party analytics apps. What else? What about analytics within specific third party apps? Here we will take the example of Vectors suite. Since our apps are dedicated to knowledge management and collaboration, they all come with dedicated dashboards where users can have an overview of users activity.
In the example of Ideation for Confluence cloud, users have a dedicated index page where they can find all the ideas created within a given space. They can rank ideas based on their statutes, number of views, comments, votes and more. As for FAQ for Confluence, there is also an index page filled with key metrics about the number of FAQ pages created, questions, percentage of votes, and more.
What’s next for Confluence Analytics?
Well you know the answer for this: Artificial Intelligence. In the last year or so Atlassian invested heavily in AI. At Team 24, Atlassian Rovo came into the scene. Rovo is designed to automate a variety of actions within Confluence and Jira and help users unlock knowledge.
Based on the various demos, AI is going to take Confluence analytics to new heights. Basically moving from descriptive to actionable data, as users can now easily scroll the entirety of their Confluence site through AI and get detailed information about whatever they are looking for. In other words, the possibilities are endless for Confluence in general and analytics in particular, and we can’t wait to see and explore Atlassian’s next steps.