


As project management continues to evolve and become more automated, Jira has emerged as a versatile platform designed to help teams plan, track, and manage their work. So, If you’re a fan of agile frameworks or you use agile project management, chances are you’re familiar with the use of Jira or you may be considering it.
Whilst you’ll obviously find “Projects” to be a major component of your Jira use, Jira dashboards are an essential part that you should not overlook.
Jira dashboards are a powerful tool for project management that help teams stay on track and monitor projects’ progress more effectively.
In this article, we’ll explore the basics of Jira dashboards. From what they are, steps to create your first Jira dashboard, to What you need to consider to make a good Jira dashboard.
What is a Jira Dashboard?
Jira dashboards are reporting tool in Jira to track and monitor a project in your Jira Space.
Simply put, it is a blank sheet where you’ll be able to customize your report by selecting the right gadgets.
The native Jira gadgets are dynamic and update automatically, providing a real-time view of a projects’ data. In order to give teams and stakeholders a broader picture of what’s going on, Jira dashboards display multiple charts and graphs at once,
One key difference that distinguishes dashboards from the typical Jira reports is that you can create a dashboard to cover multiple projects, whereas a report is confined to one project only.
👉 Learn more about Jira reports
Steps to Create a Jira Dashboard:
Create your Jira Dashboard:
Once you navigate to your project space, click on “Dashboard” in the top menu (next to “Spaces”) > Click on “Create a new dashboard” , the “Create dashboard” panel will appear.

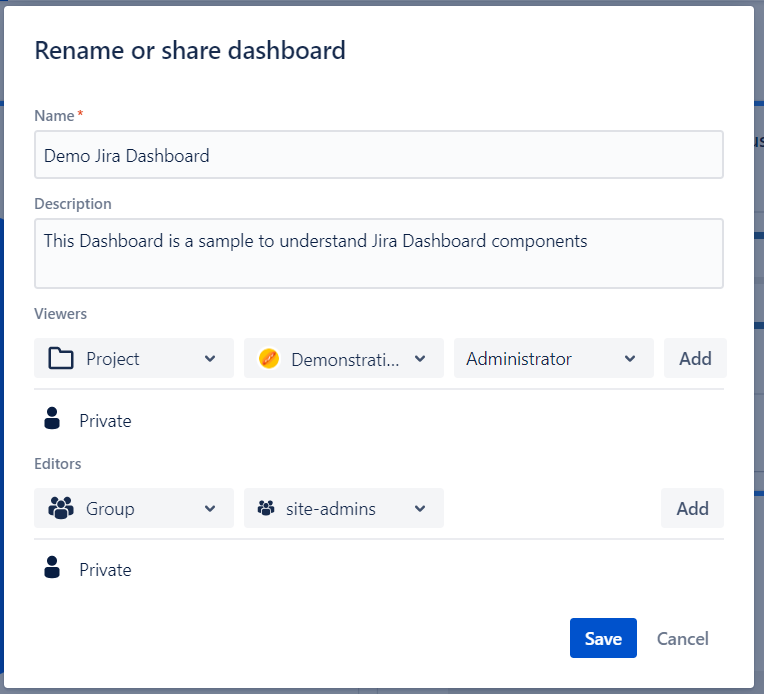
Introduce your dashboard Name, a short Description and select list of Viewers and Editors you would like to be able to access this dashboard.
You can keep the dashboard “Private”, include viewers/ editors by user name, select your whole organization, by Project Name, or by Group for example your “site-admins”
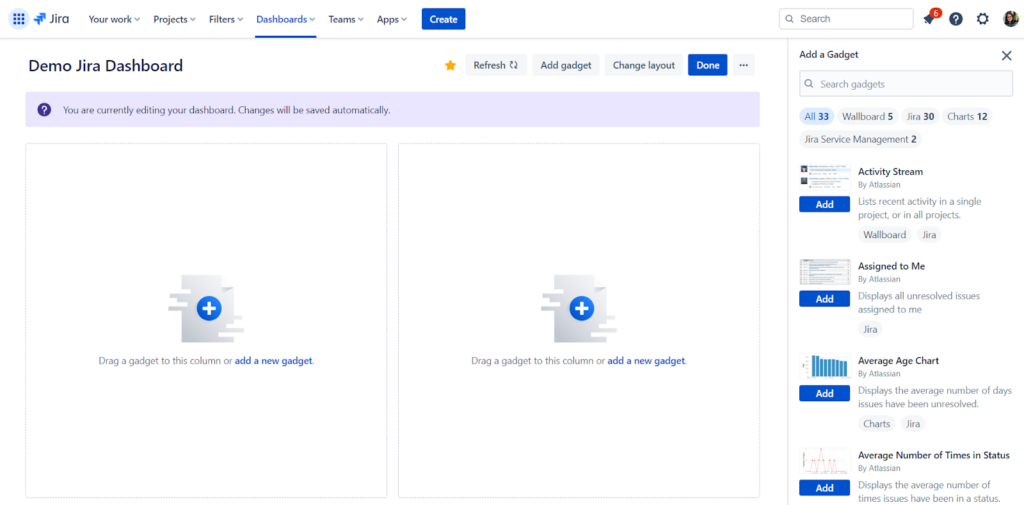
Add and Configurate Gadgets to Jira Dashboards:
Go through the list of Jira native gadgets at your disposal and select the gadgets you want to use in your project dashboard;
Once you choose the gadget, click “Add”.
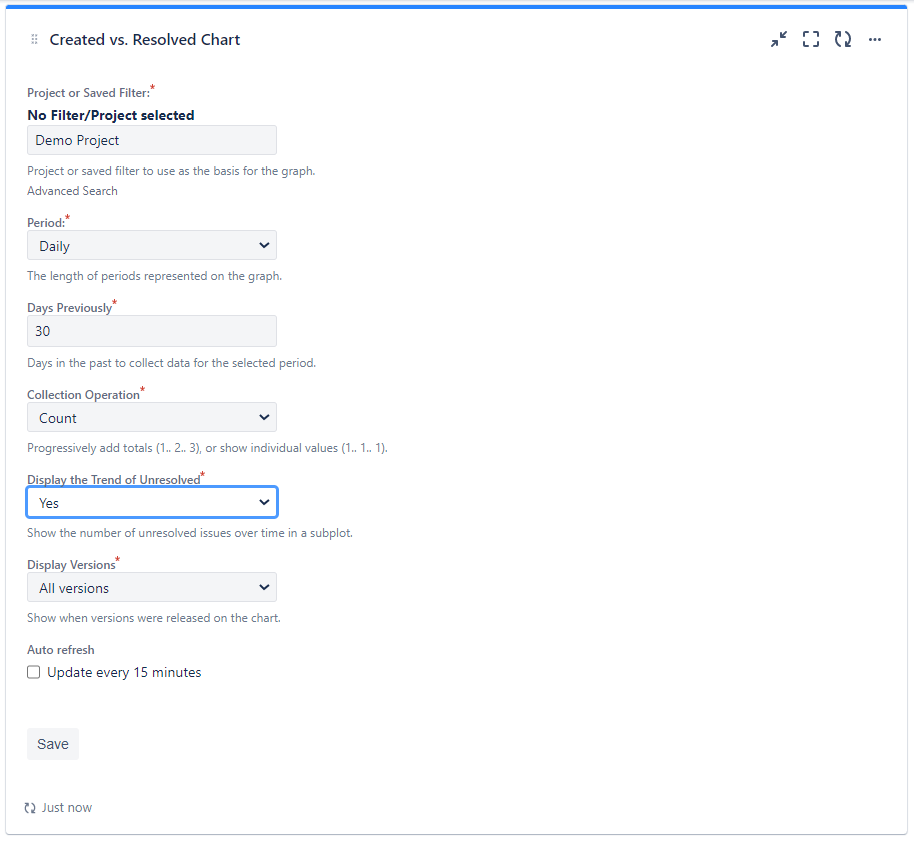
Set up your gadget by including its specific details like “Project Name” , the project you are analyzing in this dashboard , and other custom fields with relevant information.
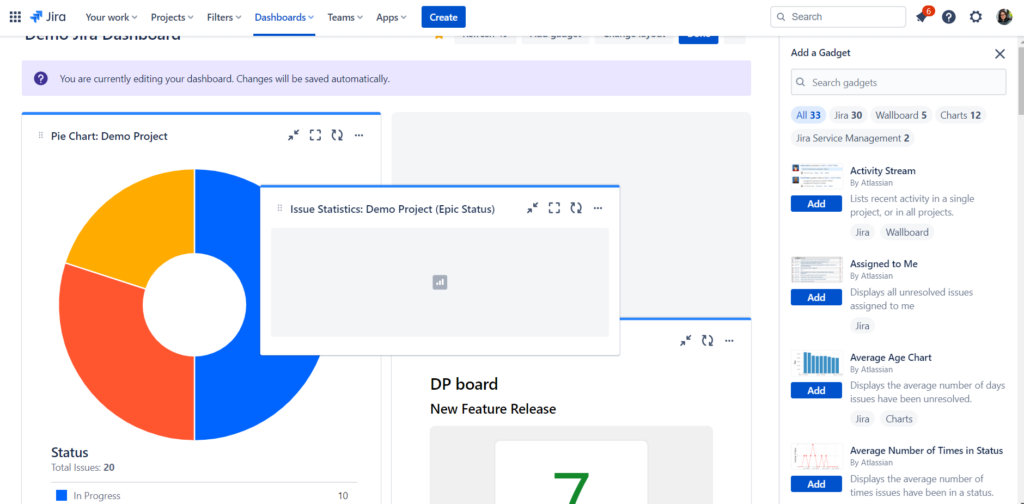
Organize and Structure Jira Dashboards
You can easily move charts and graphs around on your dashboard just by dragging and dropping them.
Furthermore, you are able to edit and change the layout of your dashboard.
Click “Edit” the “Change Layout” and choose a layout.

Your dashboard’s layout will be updated once you select the new layout.
Share Jira Dashboards
Once you created your dashboard, it is likely you’ll want to share it with others.
Then, Simply click on the menu next to “Edit” and Select “Rename or Share”
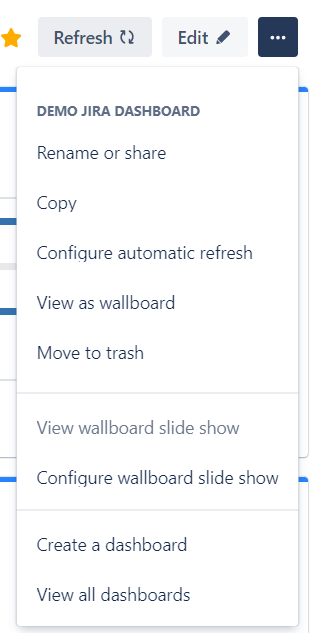
A panel will appear where you can edit your sharing settings for Dashboard Viewers and Editors.
Jira Dashboards’ Gadgets:
Here is a glimpse of what Jira offers for Dashboard gadgets! These are some of the most useful gadgets you can use in your Jira dashboard:
- Jira Issues Calendar: This Gadget provides a simple calendar format to display issues based on their end date. It is useful for a general report on issues in a project or multiple projects’ progress.
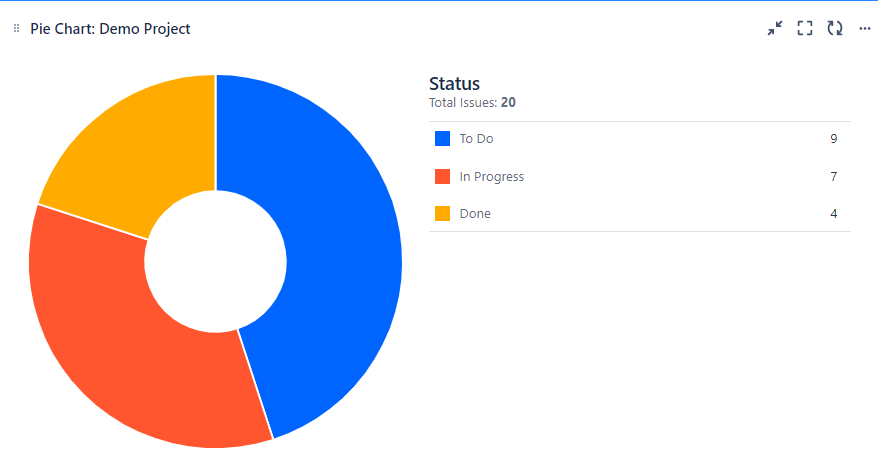
- Pie Chart: This Gadget showcases statistics for issues, assignees, or other fields and attributes in a pie chart format.
- Issues in Progress Gadget: This Gadget displays the list of Issues that are in progress status and that are assigned to the signed-in viewer of the dashboard.
It could be used as a complementary gadget to the “Assigned to Me” gadget.
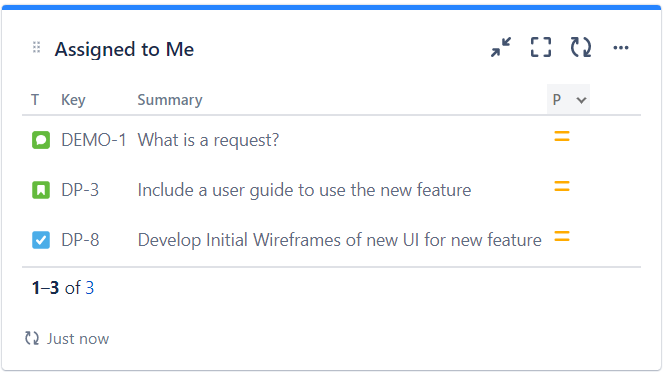
- Assigned to Me: This Gadget displays the to-do and in-progress issues for the signed-in user across all projects.
- Time to First Response: This Gadget displays the number of hours taken to respond to issues.
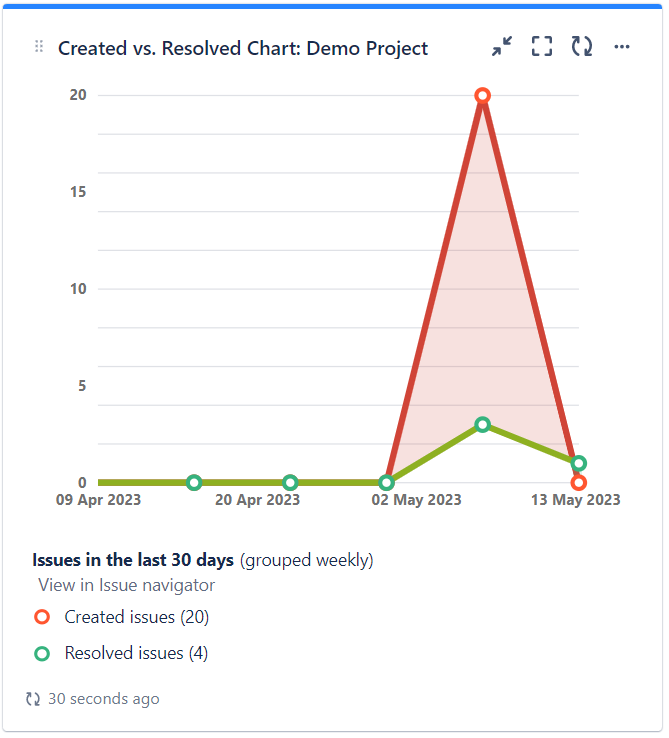
- Created vs. Resolved Chart: This gadget tracks team performance by comparing the number of issues created versus resolved. It is significantly useful for Kanban teams.
- Sprint Burndown Gadget: The Sprint Burndown gadget displays the sprint estimate, along with other information for active sprints only. This gadget is useful for Scrum teams.
Whilst it may seem a bit difficult to grasp all jira gadgets in dashboards. It’s a bit of a cliché, but Practice makes Perfect!
As you gain more experience, you’ll get better at making the most of them.
👉 Discover more about Jira dashboard gadgets and their functionalities with Atlassian’s “Use dashboard gadgets” document.
Best Practices to Keep in Mind
When it comes to best practices for Jira dashboards, it’s important to remember that dashboards are a flexible tool, but here are a few things to keep in mind when building your Jira dashboard.
1. Understand your Audience
Narrowing down your audience will help you tell a more specific story and create a dashboard that is relevant and valuable to your audience.
By targeting the right audience, you can ensure that your dashboard aligns with your personal, team, or organizational objectives and goals.
2. Limit your Gadgets
You do not want a messy and condensed dashboard, where it’s difficult to visibly track information provided with the dashboard.
So, to overcome this common mistake of adding any and every native jira gadget there is. Start with a few crucial measures and add gadgets as needed.
Pro tip! Prioritize up to 5 or 6 gadgets, no more! 6 gadgets seem plenty enough to relay and measure any metrics you need in your dashboard.
3. Tell a Story
A Jira dashboard shouldn’t just be a list of facts. It should engage your audience, and spur them to action.
By crafting a story, you can communicate important data and insights in a more meaningful way, and get your audience invested in taking action based on the dashboard’s information.
4. Keep Adjusting & Improving
A Jira dashboard should be continuously adjusted to reflect changes in the team’s goals, processes, and data needs. So, you can ensure that it remains useful and valuable to the team.
Jira dashboards can be powerful tools for project management, but creating an effective dashboard requires careful planning and consideration.
These practices will help you get started on the path to mastering your jira dashboards, enabling you to not only monitor the progress of your projects but also to inspire action and foster success.